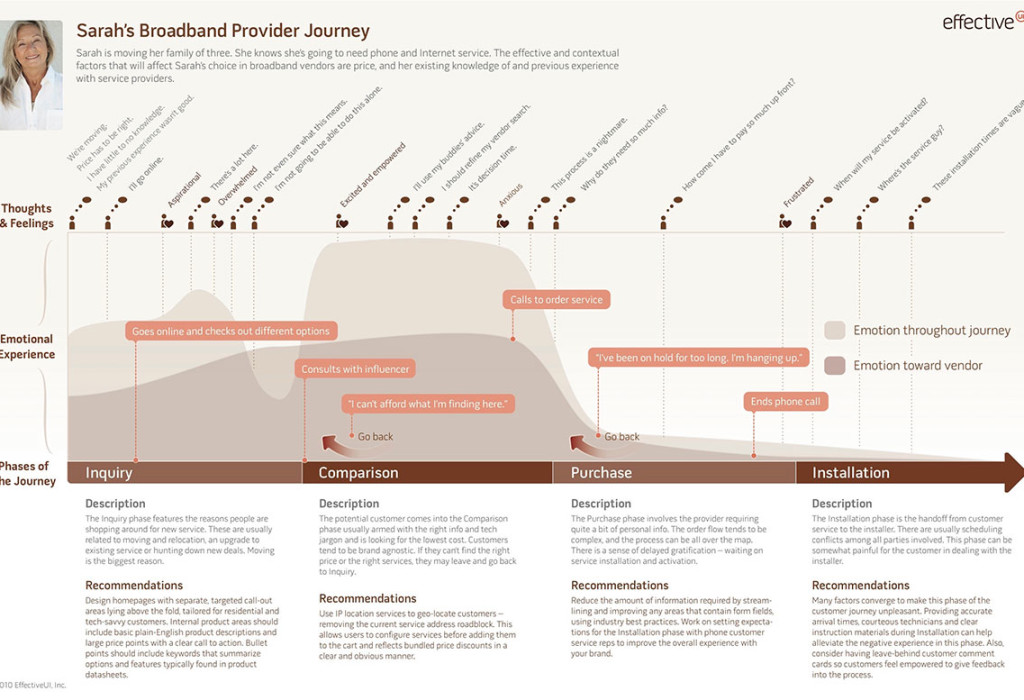
The User Journey Mapping is not a documentary of every path of the user. It is meant to represent the typical user interactions to keep the design team focused on the user’s needs at all times. The map measures things like the user’s pain points to indicate where we should be focusing our time. Journey mapping can also be a measurement of success to upper management. It is a way to portray the user experience.
Two types of research can contribute to the journey mapping process:
- Analytical Research – Research from Google Analytics can be misread easily, such as a long amount of time spent on a page can mean they are delighted, or it could mean they are confused and stuck
- Anecdotal Research – Research about how the user is feeling, such as the retelling of experience on social media.
A successful journey map is based on the routine behaviors and a real desire to get to know the user on a detailed level. It also can be used to display behavior across different business verticals, such as the experience of moving between the online store and brick and mortar stores, or how the customer moves between departments of one store. Journey mapping allows us to view the total and whole experience of the user.
Presenting the Journey Map
There is no right or wrong way to present, but usually it is presented as a large infographic. It could also be a story or video. The end result is to motivate the team to create products that are usable, and to remind the team who you are building this for.

References
http://www.smashingmagazine.com/2015/01/all-about-customer-journey-mapping/
